The review notebook
A simple place to capture the context, decisions, and lessons behind a session.
Resource notes
Leave a record you can return to
A useful notebook makes it easier to remember what you saw and why you made a decision. Start with the context, keep observations separate from interpretations, and finish with one question to revisit.
The structure below is deliberately simple. Copy it into your own notes and adapt the prompts to fit the way you work.
01. Capture the context
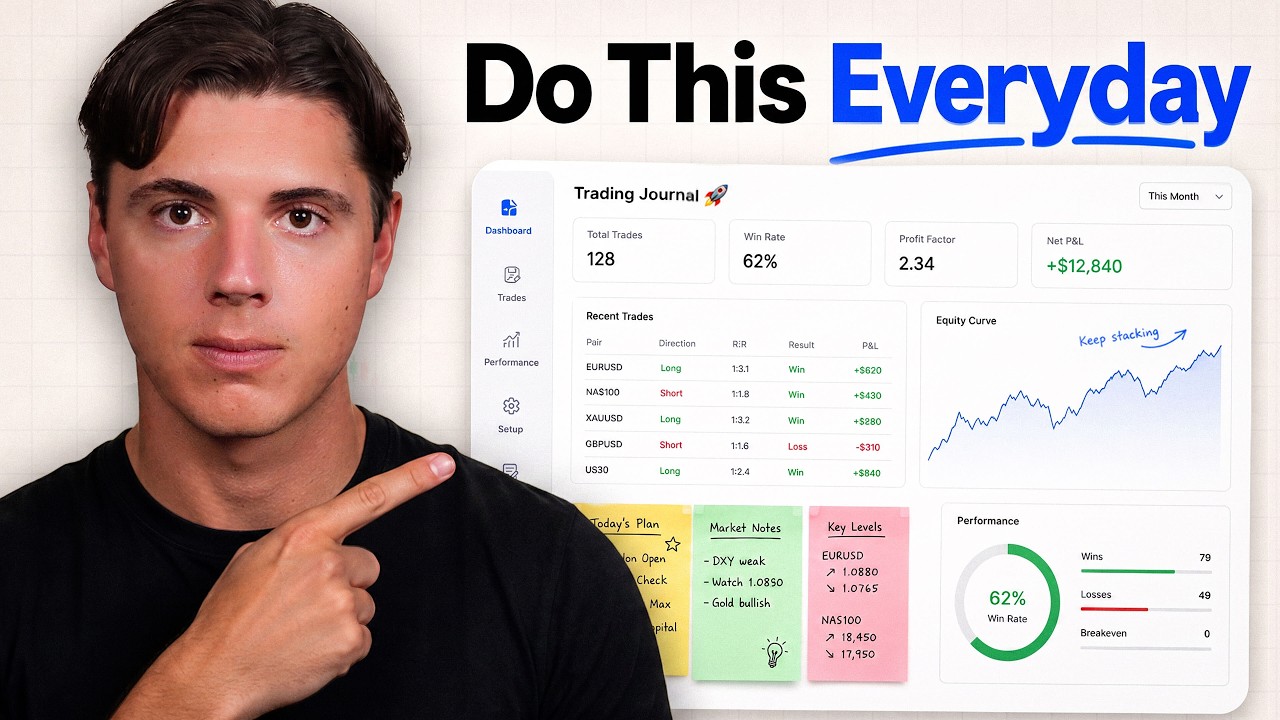
Record the date, the instrument you observed, and the question you wanted to explore. Add a screenshot or an annotated chart so that a future reader can understand the setting without relying on memory.
Field | What to capture |
|---|---|
Session | Date, time, and instrument |
Context | What was happening before your decision |
Observation | What you could actually see |
Decision | What you chose to do, including waiting |
Follow-up | The question you want to revisit |
02. Separate the observation from the story
Write down the sequence of events before explaining it. It helps to give each part its own space:
What I observed: the information available at the time.
What I expected: the scenario I had in mind.
What I decided: the action I took and the reason I recorded.
What I learned: the question or observation I want to carry forward.
A good note should make sense even when you have forgotten the session.
03. Keep the format repeatable
Use the same short template each time. A plain-text version is easy to paste into a notes app or a journal.
SESSION
Date:
Instrument:

CONTEXT
What did I observe?
What did I expect?

DECISION
What did I do, and why?
What information was available at the time?

REVIEW
What needs a second look?
One question for the next session:
04. Give the notes some perspective
Charts can sit directly inside an article, next to the explanation that gives them meaning. This example tracks the number of journal entries in a fictional week.
Illustrative data only. These numbers demonstrate the chart format; they are not trading results.
View chart data
| Label | Value |
|---|---|
| Mon | 2 |
| Tue | 3 |
| Wed | 1 |
| Thu | 4 |
| Fri | 3 |
Before you close the notebook
I recorded the context and the information available.
I added the relevant screenshot or chart.
I separated observations from interpretations.
I left one clear question to revisit.
Keep the process small enough that you can return to it. The value is in having a record you can read, compare, and improve over time.